Now, make the most informed decisions possible knowing the actual profit generated by individual Google Ads keywords based on revenue, spend and your own, individual COGS.
Google Ads doesn’t provide actual profit it generates because it cannot take into consideration COGS. Here is an example of what Google Ads now provides…
A Google Ads keyword has a Conv. Value/Cost of 7.6. This means that, for every $1 spent, a return of $7.60 is generated by that keyword. (1)
The Conversion Value metric Google provides considers how much was spent on ad click-throughs (the ad spend) plus the revenue generated by the clicks. (2)
Below is the formula Google uses for Conv. Value/Cost…
Revenue Generated By Keyword (or Shopping Product Group)
less Spend
= Conversion Value / Cost (or, Return On Advertising Spend)
But, Conversion Value / ROAS is not the same, nor as telling, as Net Profit. To determine true ROI, COGS would need to be included in the equation to get a Net Profit amount.
The Google Ads Conversion Value formula does not consider COGS. So, Conversion Value / ROAS is as good as advertisers can get.
Until now.
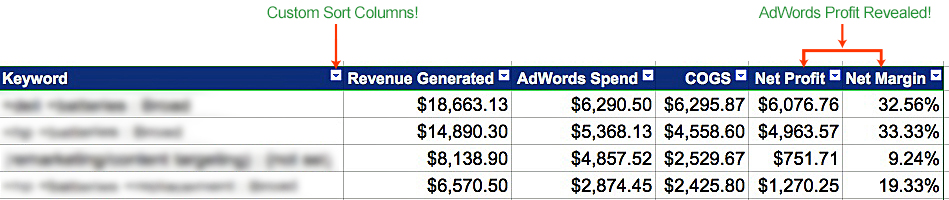
Google Ads Profit Revealed…At-A-Glance
DMG’s Google Ads Profitability Report adds COGS to the equation.
Revenue Generated By Keyword (or Shopping Product Group)
less Google Ads Spend
less COGS
= true Net Profit Margin
DMG’s Google Ads Profitability Report is accurate. At-a-glance, you’ll discover:
/ Net Profit Margin ($ and %)
/ generated by each individual keyword
/ and Shopping Product Group.
Actionable Analysis From Google Certified Partner Experts
DMG provides sophisticated, in-depth analysis of what the Google Ads Profit Report data means.
Not just the What, but, the What It All Means and the What To Do About It, too.
/ Discover Opportunities To Maximize Google Ads Profit
/ Identify Keywords Not Pulling Their Weight
/ Pinpoint Profit- Generating Keywords
/ Determine Shopping Campaign Products Winners & Losers
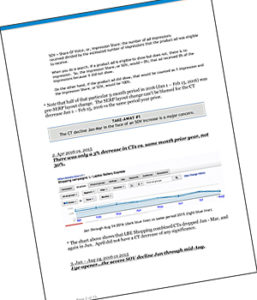
An example from a recent analysis…
FACTS
/ For a business with a total of 1,378,203 keywords and Shopping product groups, there are 2 keywords that generate the greatest amount of revenue. Both are Broad Modified match types.
/ One keyword is in an Ad Group with 48 other Broad Modified keywords. The other is in a Group with 4 other Broad Modified phrases.
/DMG’s Google Ads Profitability Report shows that, through 3 quarters, the net margin for all keywords combined is trending up, from 56% in Q1 to 59% in Q3.
/ However, the Report also shows that profit on those 2 most important keywords has been trending downward: keyword A from 34.7% down to 29.9%, and keyword B from 45% down to 31.6%.
/ Seasonality is not a factor in this instance as all products sold by this online retailer are in the same vertical; seasonal trends would effect all products virtually the same.
/ If there had been aggressive competitor pricing, it most likely would have effected all keywords, not just two.
/ Quality Scores for the 2 keywords are 9 and 10, and have not changed in a very long time.
/ The point: margins had been increasing across the board except for the two keywords that generate the greatest amount of revenue.
WHAT IT ALL MEANS
DMG’s Google Ads Profitability Report, as well as all other facts, tells us that there is an opportunity.
Instead of being part of one Ad Group along with multiple other key phrases as they are now, given the target net profit objective and given the importance of these 2 keywords and given the amount of spend invested in these 2, each of these 2 particular phrases need to split into 4 separate Campaigns.
This is called Query Level Targeting.
WHAT TO DO
1. Segment each of these keywords into its own Campaign. Just 1 Campaign each. No other keywords, like this:
/ Phrase A, Campaign 1: Generic Queries
landing page: category page
/ Phrase A, Campaign 2: Brand Queries
landing page: brand page
/ Phrase A, Campaign 3: Model Queries
landing page: model page
/ Phrase A, Campaign 4: Long Tail Queries
landing page: product page
2. Since each of the 4 Campaigns will have the same keyword, use negative keywords for each Campaign. This is so Google knows which Campaign’s ad (and landing page) to show for a given query.
Negative keywords will prevent the ad (and landing page) for a long tail query to be shown by Google for a brand query, for example.
3. To start, use the same text ads for each Campaign. This will eliminate one additional variable.
4. Set Campaign Priority accordingly.
The 4 Campaigns then can be managed individually and squeezed for every penny due to the granular segmentation.
Example: bids could be set based on query strength. And, each Campaign would have its own Quality Score, Search Impression Share, Bounce Rate, CPA, CTR, etc.
All of this would allow for fine-tuning to such a degree that the combined net Google Ads profit should be beat that of the status quo.
DMG is a Google Certified Partner Agency. We have been making money for clients with PPC since 1998.
We do not set Google Ads to auto pilot and let the thing run, as so many agencies do. We are not a sweat shop, either. We do not ask our people to handle more accounts than they can possibly manage. Finally, we do not outsource.
Instead, we provide experienced PPC management and seasoned critical thinking. Our clients are treated as if it’s our own money on the line.
We care.

How DMG’s Google Ads Profitability Report Works
Data is pulled from your Ads and Analytics accounts. It is combined with your COGS.
The data is then displayed in an easy-to-understand and use online, sharable spreadsheet.
/ Keyword and Match Type (or Shopping Product Group)
/ Revenue Generated (by Keyword + Totals)
/ Spend (by Keyword + Totals)
/ COGS (by Keyword + Totals)
/ Net Profit Margin ($) (by Keyword + Totals)
/ Net Profit Margin (%) (by Keyword + Totals)
/ Customizable Date Range
There is also advanced filtering.
/ Sort A-Z, Z-A
/ Filter By Condition (text contains; text starts with, custom filter, etc.)
/ Filter By Value (the values in any of the spreadsheet cell or cells)
DMG’s Google Ads Profitability Report is available as a one-time project with a one-time fee. It is also available on a month-to-month basis; no contract necessary.
What’s Needed From You
DMG will need a few things from you in order to deliver a great, actionable report.
1. Edit permission level to Google Analytics.
2. A CSV or XLSX file containing the following row headers: SKU and Cost
3. Google Ads account linked to Google Analytics.
4. Ecommerce tracking installed.
Google Ads Profitability Report Pricing
$795 Online Spreadsheet Only, 30-Day Access
$1,995 Online Spreadsheet 30-Day Access + In-Depth Written Analysis
The Online Spreadsheet is also available on a month-to-month, reduced rate basis with no contract required.
* DMG reserves the right to end the offer sooner based on demand. First come, first served.
The Fine Print
/ Max amount of keywords = 5,000
. Can be keywords or Shopping Product Groups or a combination thereof.
. An expanded version of DMG’s Google Ads Profitability Report is available. Call for a custom quote.
/ Spreadsheet only turnaround time: 8 business days after receiving Google Analytics & Ads access, and COGS file.
/ Spreadsheet and in-depth, written analysis turnaround time: 14 business days after receiving Google Analytics & Ads access, and COGS file.
/ A 20-minute online meeting is required to present to you the finished product.
/ We realize that handing us a file containing your COGS is no small matter. We will be glad to sign a Non-Disclosure Agreement. In fact, we insist on it.
/ It is necessary for DMG to ask that you, too, make certain promises. Included: you agree not to reverse-engineer our work; you agree that your custom Google Ads Profitability Report is for the advertiser’s eyes only. Giving / sharing of your Report in any manner with any 3rd-party is strictly prohibited unless authorized in writing by DMG. Note that the written Analysis may be shared; simply not the spreadsheet.
(1) Google Ads can only provide Conversion Value metrics when an ecom store is a) linked to the store’s Analytics account, and b) the store is passing revenue data through to Google Analytics. Without such connections, Google Ads is unable to calculate Conversion Value.)
(2) Note that shipping is included as revenue in Google’s figures. Shipping should not be included in revenue figures for ecom stores unless it is, itself, a profit center.)
Google, Google Ads & Google Analytics are registered trademarks and service marks of Alphabet, Inc.